This atlas and the linked publication [1] aim to give a visual overview over T2-weighted anatomical imaging and T2* relaxometry placental data. Both have been widely used in the last years to assess placental structure and function in-vivo [2-10].
Data from healthy controls is displayed over GA, different acquisition choices and possible dynamic effects are depicted and placentae from different cohorts affected by complications are shown.
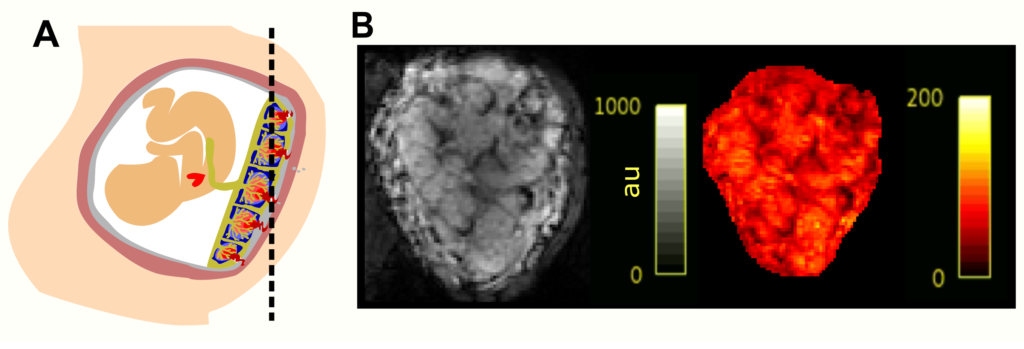
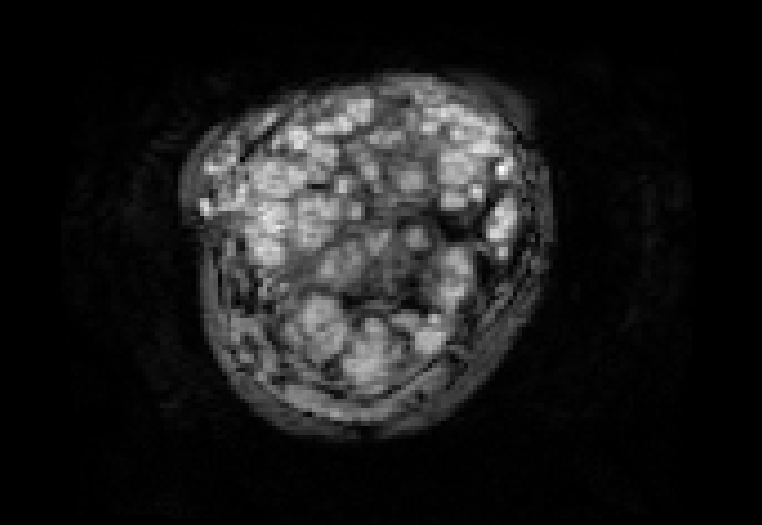
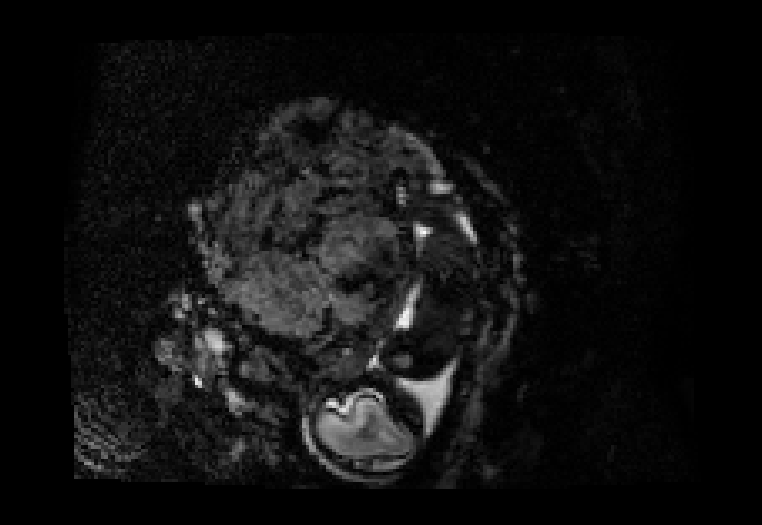
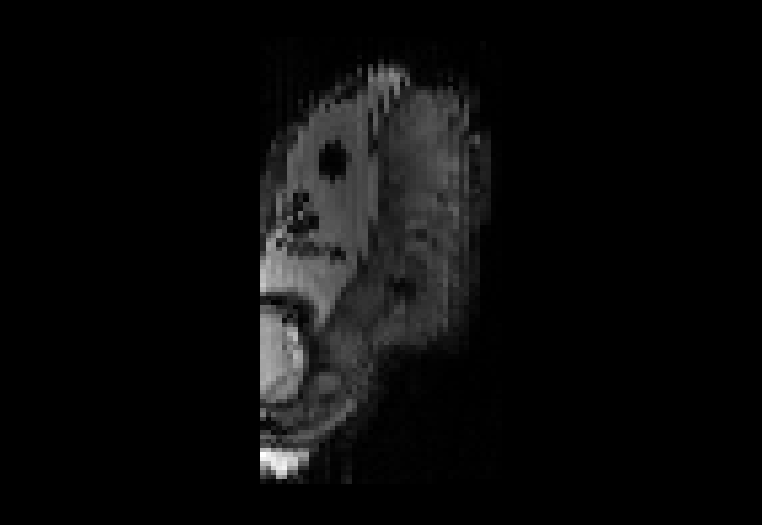
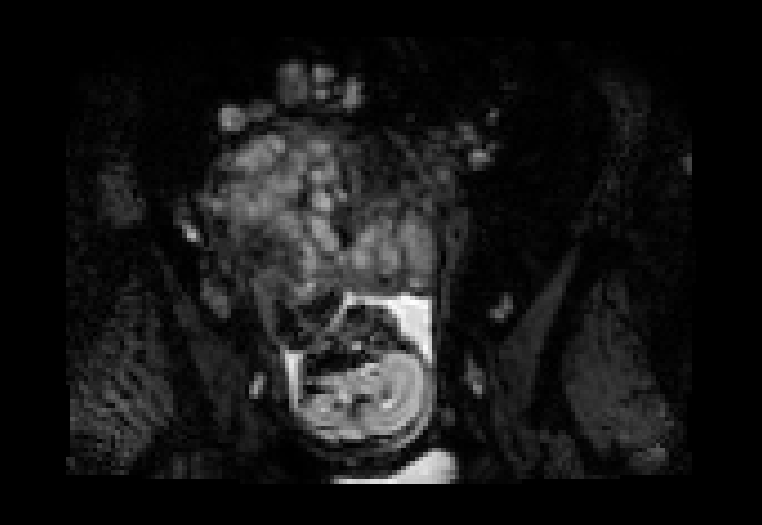
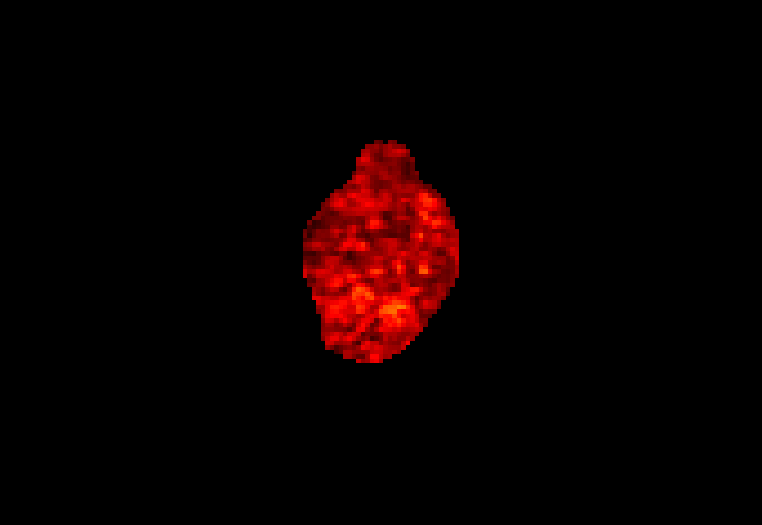
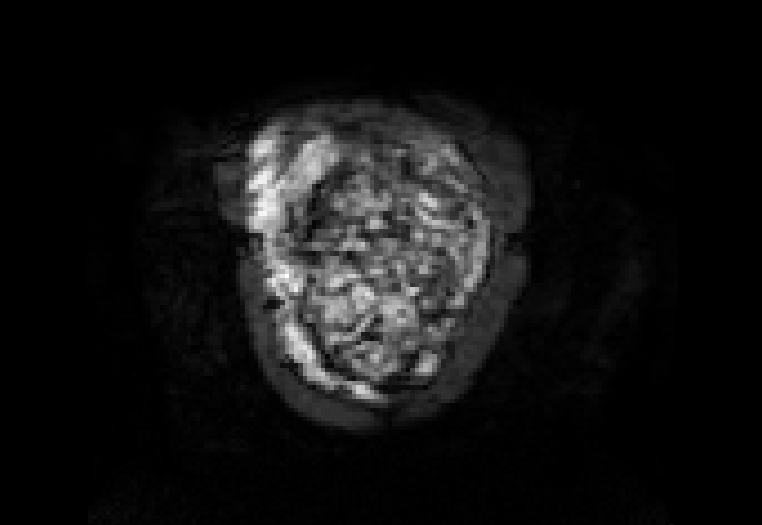
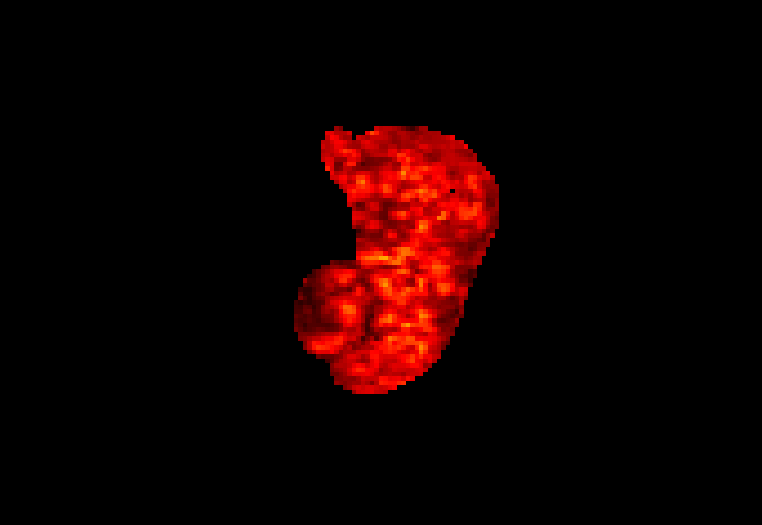
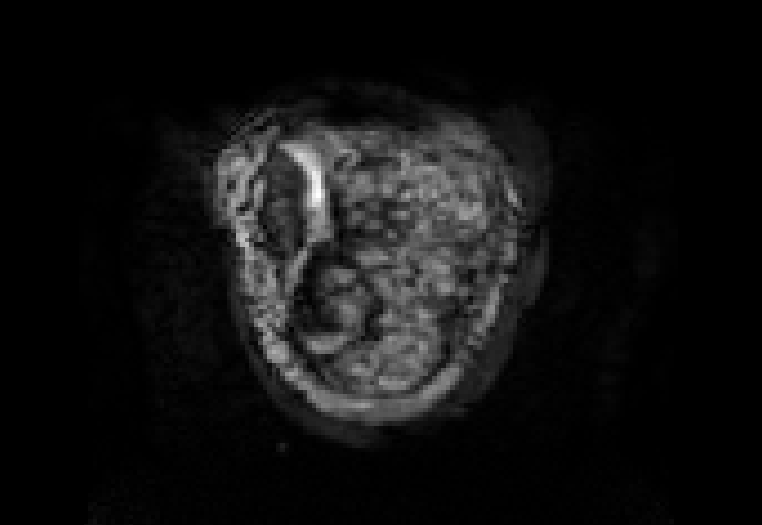
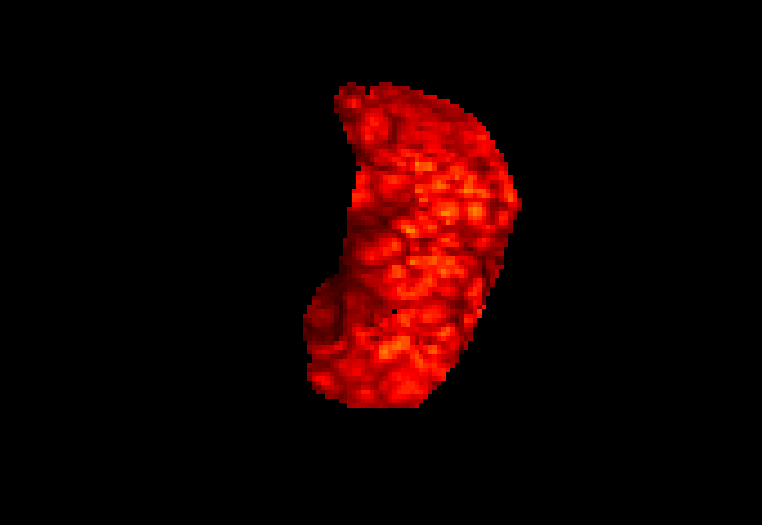
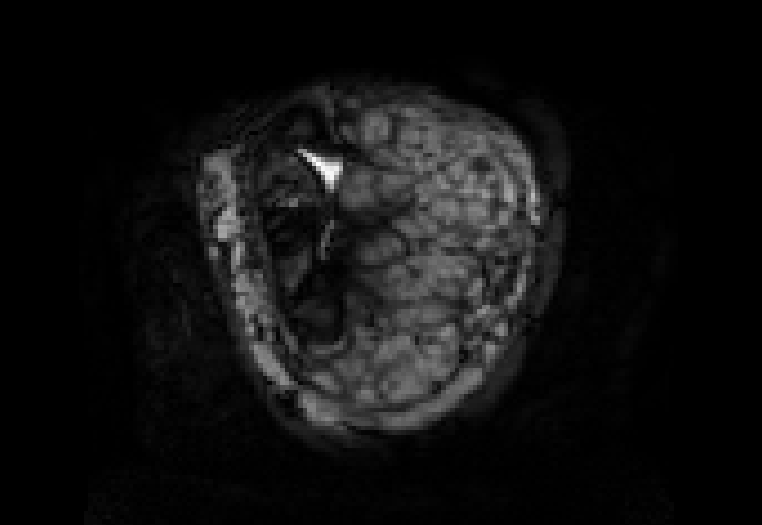
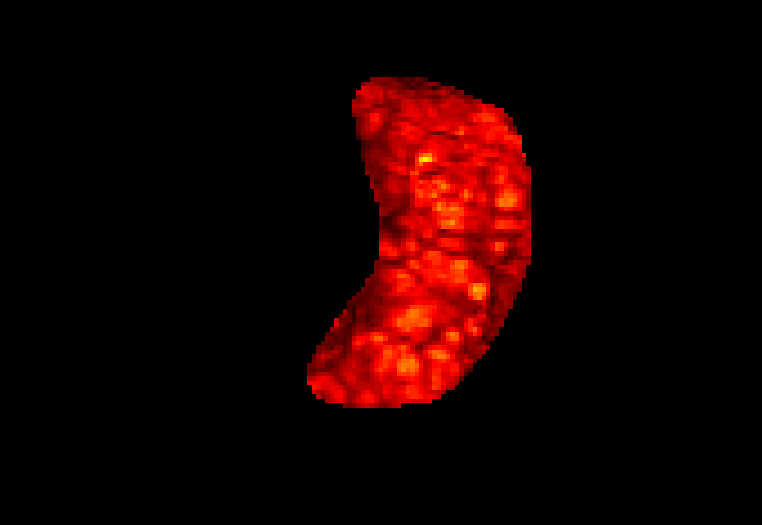
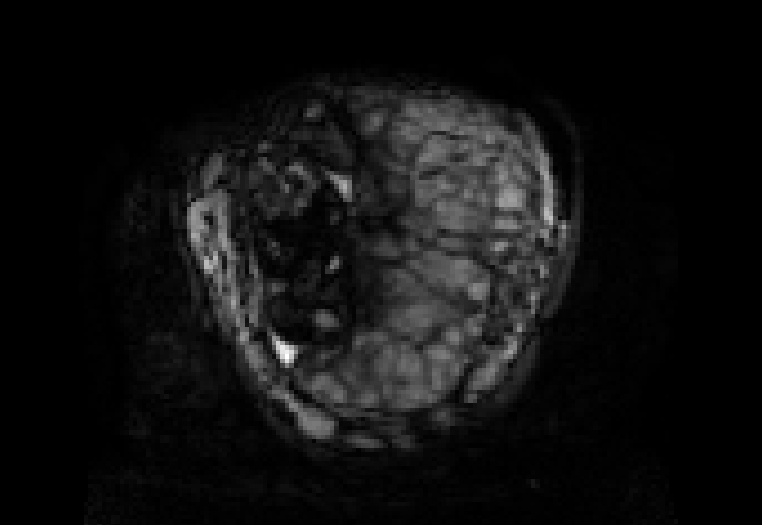
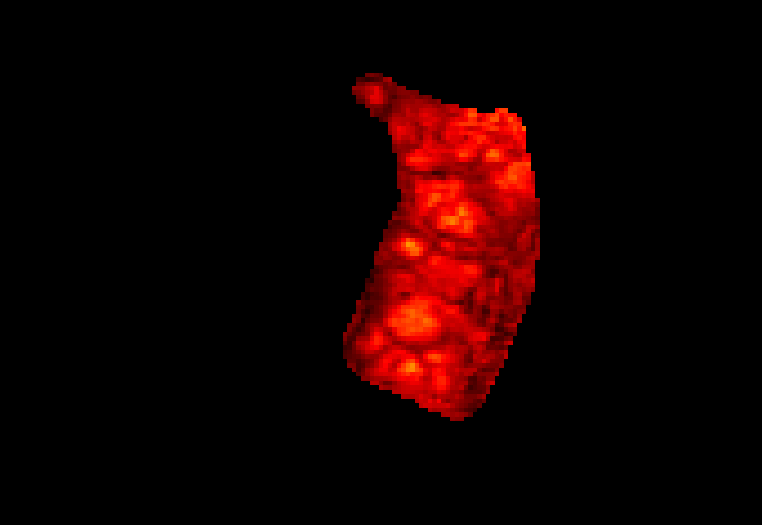
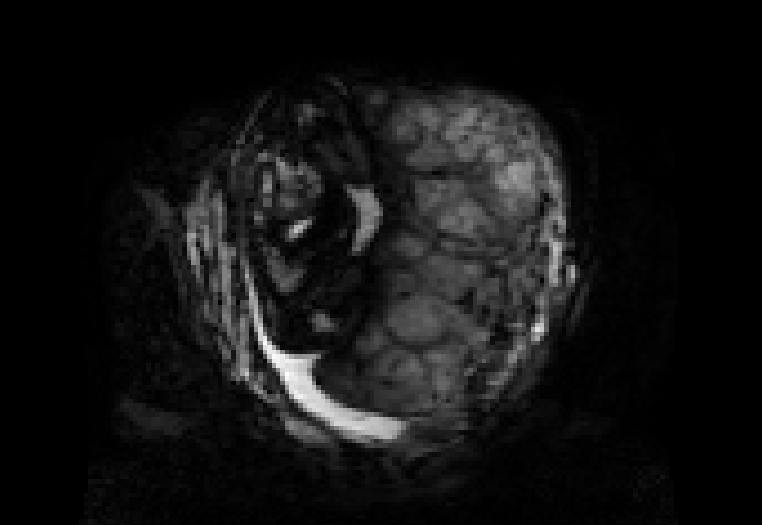
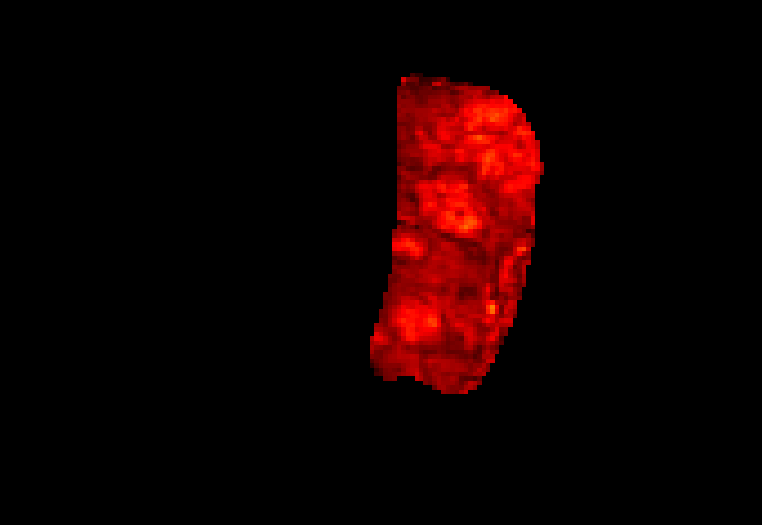
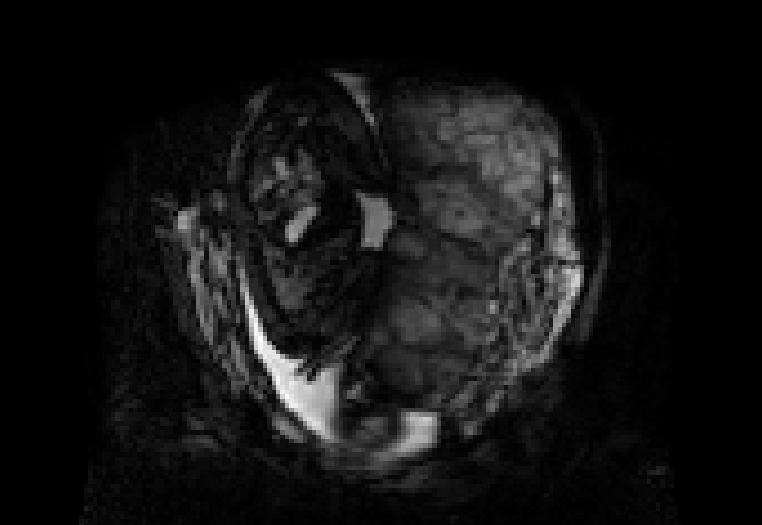
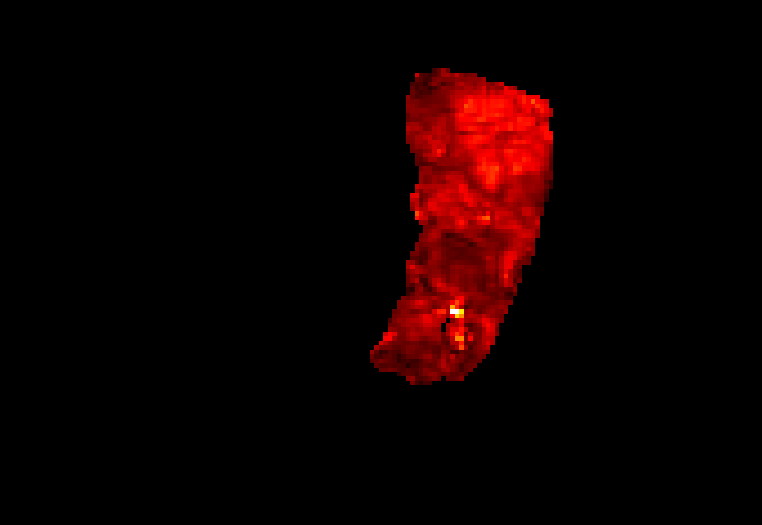
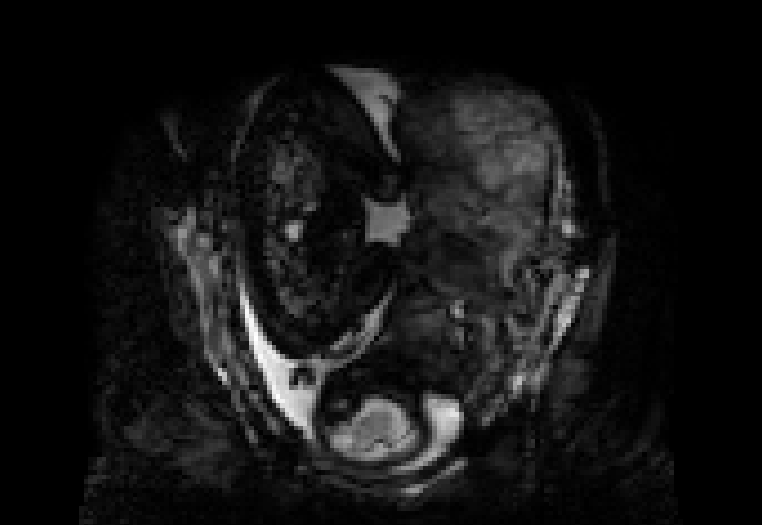
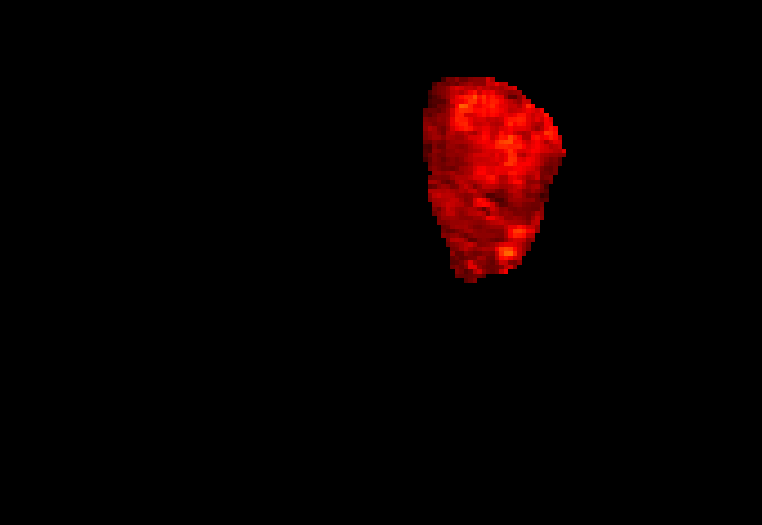
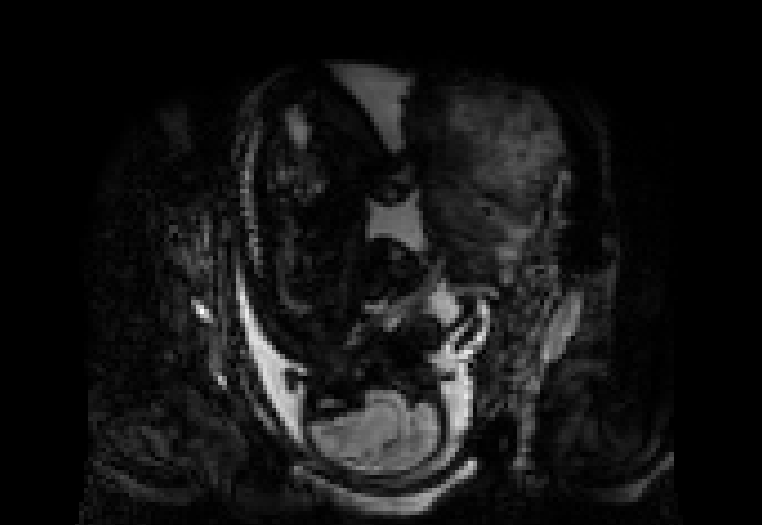
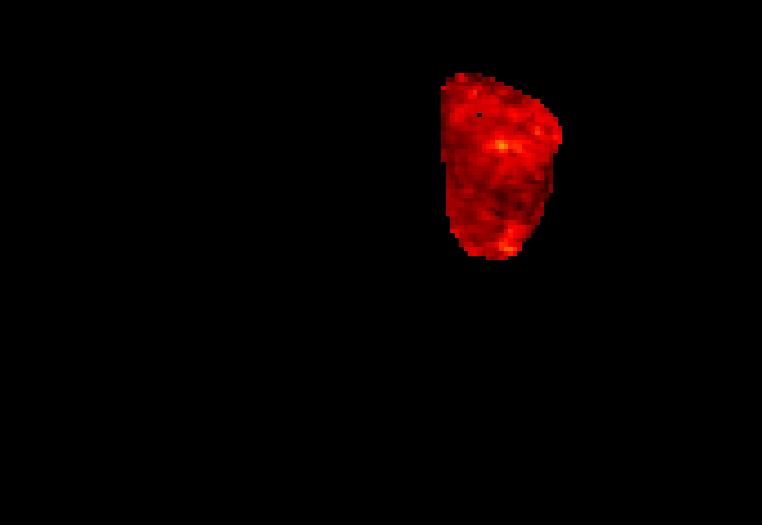
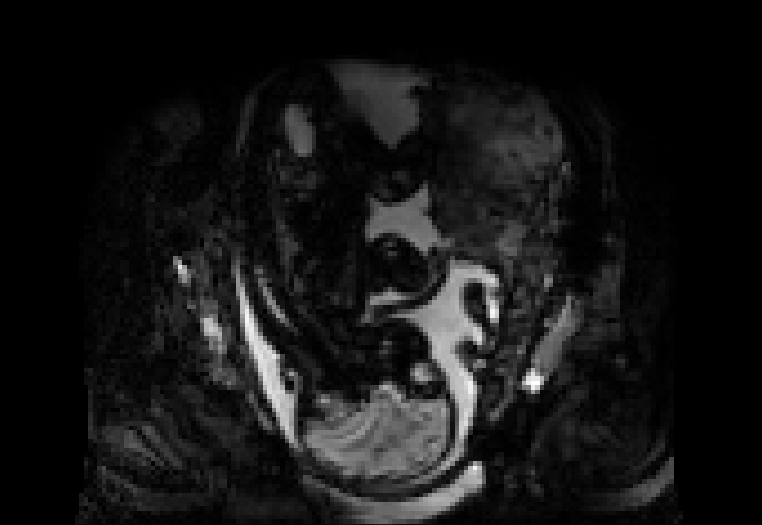
Display description: All placentae are shown in maternal coronal plane (See A). The slice with the largest placental volume was chosen. The same colormap was chosen for all placentae (See B).


Reference:Ho A, Chappell LC, Story L, Al-Adnani M, Egloff A, Routledge E, Rutherford M, Hutter J. Visual assessment of the placenta in antenatal magnetic resonance imaging across gestation in normal and compromised pregnancies: Observations from a large cohort study. Placenta. 2021 Oct 14;117:29-38. doi: 10.1016/j.placenta.2021.10.006. Epub ahead of print. PMID: 34768166. https://pubmed.ncbi.nlm.nih.gov/34768166/